Address
304 North Cardinal St.
Dorchester Center, MA 02124
Work Hours
Monday to Friday: 7AM - 7PM
Weekend: 10AM - 5PM
Address
304 North Cardinal St.
Dorchester Center, MA 02124
Work Hours
Monday to Friday: 7AM - 7PM
Weekend: 10AM - 5PM

Description
The Processed DataSet can be downloaded from the following link
If you prefer to work with the original DataSet it can also be downloaded from the following link
Context
I fixed a lot of problems within the dataset in part 1 of this notebook. Now, you can download the fixed dataset and continue with part 2. Part 1 is done, and you can get the dataset from the link above. I’m sharing part 1 to help you understand what I did with the dataset. If you prefer to work with the original dataset, you can download it along with the processed one.
If you want to quickly run and test this notebook on Kaggle, just click on this link
Content
Each app (row) has values for App id, installs, category, rating, size, price, rating count, and more.
Acknowledgements
This data is scraped from the Google Play Store. Without it, we wouldn’t have this valuable app information. The data from the Play Store has huge potential to help app businesses succeed. Developers can use it to gain useful insights and conquer the Android market!
import pandas as pd  # Data manipulation and analysis library
import numpy as np   # Numerical computing library

# Visualization Libraries
import matplotlib.pyplot as plt  # Data visualization library
import seaborn as sns            # Statistical data visualization library
%matplotlib inline
Load the csv file with the pandas.
creating the dataframe and understanding the data present in the dataset using pandas.
Dealing with the missing data, outliers and the incorrect records.
# Load the Dataset
df = pd.read_csv('./Data/Google-Playstore.csv')
Viewing the first five Rows of the data
df.head().T| 0 | 1 | 2 | 3 | 4 | |
|---|---|---|---|---|---|
| App Name | Gakondo | Ampere Battery Info | Vibook | Smart City Trichy Public Service Vehicles 17UC… | GROW.me |
| App Id | com.ishakwe.gakondo | com.webserveis.batteryinfo | com.doantiepvien.crm | cst.stJoseph.ug17ucs548 | com.horodyski.grower |
| Category | Adventure | Tools | Productivity | Communication | Tools |
| Rating | 0.0 | 4.4 | 0.0 | 5.0 | 0.0 |
| Rating Count | 0.0 | 64.0 | 0.0 | 5.0 | 0.0 |
| Installs | 10+ | 5,000+ | 50+ | 10+ | 100+ |
| Minimum Installs | 10.0 | 5000.0 | 50.0 | 10.0 | 100.0 |
| Maximum Installs | 15 | 7662 | 58 | 19 | 478 |
| Free | True | True | True | True | True |
| Price | 0.0 | 0.0 | 0.0 | 0.0 | 0.0 |
| Currency | USD | USD | USD | USD | USD |
| Size | 10M | 2.9M | 3.7M | 1.8M | 6.2M |
| Minimum Android | 7.1 and up | 5.0 and up | 4.0.3 and up | 4.0.3 and up | 4.1 and up |
| Developer Id | Jean Confident Irénée NIYIZIBYOSE | Webserveis | Cabin Crew | Climate Smart Tech2 | Rafal Milek-Horodyski |
| Developer Website | https://beniyizibyose.tk/#/ | https://webserveis.netlify.app/ | NaN | http://www.climatesmarttech.com/ | http://www.horodyski.com.pl |
| Developer Email | jean21101999@gmail.com | webserveis@gmail.com | vnacrewit@gmail.com | climatesmarttech2@gmail.com | rmilekhorodyski@gmail.com |
| Released | Feb 26, 2020 | May 21, 2020 | Aug 9, 2019 | Sep 10, 2018 | Feb 21, 2020 |
| Last Updated | Feb 26, 2020 | May 06, 2021 | Aug 19, 2019 | Oct 13, 2018 | Nov 12, 2018 |
| Content Rating | Everyone | Everyone | Everyone | Everyone | Everyone |
| Privacy Policy | https://beniyizibyose.tk/projects/ | https://dev4phones.wordpress.com/licencia-de-uso/ | https://www.vietnamairlines.com/vn/en/terms-an… | NaN | http://www.horodyski.com.pl |
| Ad Supported | False | True | False | True | False |
| In App Purchases | False | False | False | False | False |
| Editors Choice | False | False | False | False | False |
| Scraped Time | 2021-06-15 20:19:35 | 2021-06-15 20:19:35 | 2021-06-15 20:19:35 | 2021-06-15 20:19:35 | 2021-06-15 20:19:35 |
Let’s see the exact column names
# Display the column names
df.columns
Index([‘App Name’, ‘App Id’, ‘Category’, ‘Rating’, ‘Rating Count’, ‘Installs’,
‘Minimum Installs’, ‘Maximum Installs’, ‘Free’, ‘Price’, ‘Currency’,
‘Size’, ‘Minimum Android’, ‘Developer Id’, ‘Developer Website’,
‘Developer Email’, ‘Released’, ‘Last Updated’, ‘Content Rating’,
‘Privacy Policy’, ‘Ad Supported’, ‘In App Purchases’, ‘Editors Choice’,
‘Scraped Time’],
dtype=’object’)
Let’s have a look on the shape of the dataset
print(f"The dataframe has {df.shape[0]} rows and {df.shape[1]} columns")The dataframe has 2312944 rows and 24 columns
Let’s have a look on the columns and their data types using detailed info function
# Display detailed information about the dataset
df.info()
RangeIndex: 2312944 entries, 0 to 2312943
Data columns (total 24 columns):
# Column Dtype
— —— —–
0 App Name object
1 App Id object
2 Category object
3 Rating float64
4 Rating Count float64
5 Installs object
6 Minimum Installs float64
7 Maximum Installs int64
8 Free bool
9 Price float64
10 Currency object
11 Size object
12 Minimum Android object
13 Developer Id object
14 Developer Website object
15 Developer Email object
16 Released object
17 Last Updated object
18 Content Rating object
19 Privacy Policy object
20 Ad Supported bool
21 In App Purchases bool
22 Editors Choice bool
23 Scraped Time object
dtypes: bool(4), float64(4), int64(1), object(15)
memory usage: 361.8+ MB
There are 2312944 rows and 24 columns in the dataset
The columns are of different data types
The columns in the datasets are:
'App Name', 'App Id', 'Category', 'Rating', 'Rating Count', 'Installs', 'Minimum Installs', 'Maximum Installs', 'Free', 'Price', 'Currency', 'Size', 'Minimum Android' 'Developer Id', 'Developer Website', 'Developer Email', 'Released', 'Last Updated', 'Content Rating', 'Privacy Policy', 'Ad Supported', 'In App Purchases', 'Editors Choice', 'Scraped Time',There are some missing values in the dataset which we will read in details and deal later on in the notebook.
Some columns are currently stored as object data type, but they should be numeric. We’ll convert them later in the notebook once we decide which columns to keep and which to drop i.e. ‘Size’.
Let’s display descriptive statistics for numerical columns
# Display descriptive statistics for numerical columns
df.describe()| Rating | Rating Count | Minimum Installs | Maximum Installs | Price | |
|---|---|---|---|---|---|
| count | 2290061.000 | 2290061.000 | 2312837.000 | 2312944.000 | 2312944.000 |
| mean | 2.203 | 2864.839 | 183445.214 | 320201.713 | 0.103 |
| std | 2.106 | 212162.571 | 15131439.060 | 23554954.887 | 2.633 |
| min | 0.000 | 0.000 | 0.000 | 0.000 | 0.000 |
| 25% | 0.000 | 0.000 | 50.000 | 84.000 | 0.000 |
| 50% | 2.900 | 6.000 | 500.000 | 695.000 | 0.000 |
| 75% | 4.300 | 42.000 | 5000.000 | 7354.000 | 0.000 |
| max | 5.000 | 138557570.000 | 10000000000.000 | 12057627016.000 | 400.000 |
If numeric values appear in scientific notation—a method to simplify the presentation of very large or very small numbers—you have the option to adjust settings to show these numbers in full. I favor viewing numbers in their entirety, without scientific notation. Additionally, a reset option is provided, allowing you to comment it out if you wish to return the display settings to their original state.
# Set pandas display options
pd.set_option('display.float_format', lambda x: '%.3f' % x)
# Reset pandas display options
# pd.reset_option('display.float_format')Rating Diversity:
Ratings vary from 0 to 5, showcasing diverse user opinions on app quality.
User Engagement Range:
Rating Count’ spans from 0 to 138,557,600, indicating varying app popularity.
Installation Metrics Spectrum:
‘Minimum’ and ‘Maximum Installs’ reflect a wide range, from 0 to 5 billion, highlighting diverse app popularity.
Pricing Landscape:
Most apps are free (75% with a price of 0), but premium-priced apps exist, reaching a max of 399.99.
Numeric Considerations: ‘Size’ and ‘Installs’ columns may contain non-numeric characters (‘M’, ‘K’, ‘Varies with device’, ‘+’). Transforming them into numeric formats is crucial for accurate numerical operations.
Let’s clean the `Size` column first
In Statistics Observations we observed that ‘Size’ ‘ columns contain non-numeric characters (‘M’,’K’, ‘Varies with device’, ). So lets check size columns.
# Check values in 'Size' Column
df['Size'].value_counts()
Varies with device 74777
11M 62157
12M 56080
13M 48034
14M 45211
…
8.7k 1
784M 1
385M 1
7.6k 1
512M 1
Name: Size, Length: 1657, dtype: int64
You can expand the viewing limit for columns and rows by utilizing the following optional commands.
pd.set_option('display.max_columns', None) # this is to display all the columns in the dataframe
pd.set_option('display.max_rows', None) # this is to display all the rows in the dataframe
Re-check value count in ‘Size’ Column
# Check values in 'Size' Column
df['Size'].value_counts()
Varies with device 74777
11M 62157
12M 56080
13M 48034
14M 45211
16M 42474
15M 41306
17M 37244
10M 34114
18M 31707
19M 29723
21M 29023
20M 28796
22M 28261
23M 27337
24M 25301
25M 25023
26M 23897
27M 21826
28M 21157
29M 20050
37M 18658
30M 18625
31M 18150
4.9M 17967
32M 17629
4.2M 17421
3.8M 17193
3.7M 16927
38M 16811
3.4M 16752
33M 16681
4.0M 16481
3.5M 16379
3.9M 16288
3.3M 16233
4.3M 16155
3.6M 15949
4.1M 15829
34M 15163
4.4M 14946
3.2M 14936
36M 14733
4.5M 14731
2.8M 14603
2.9M 14582
5.2M 14457
3.0M 14418
5.6M 14382
5.0M 14185
2.7M 14114
5.3M 14090
4.7M 14081
3.1M 13995
4.6M 13924
35M 13846
4.8M 13758
5.8M 13450
2.6M 13363
5.5M 13333
5.4M 13201
5.7M 13200
2.5M 12790
6.0M 12749
5.1M 12694
52M 12294
5.9M 12258
6.1M 12097
2.4M 11867
6.8M 11830
39M 11681
6.4M 11666
2.3M 11640
6.3M 11488
6.5M 11435
6.2M 11435
1.4M 11424
1.9M 11327
6.7M 11225
2.0M 11224
2.2M 11177
2.1M 11164
7.4M 11072
6.6M 11063
7.7M 10959
7.2M 10833
6.9M 10783
40M 10735
7.5M 10670
7.3M 10621
7.0M 10399
8.7M 10332
1.5M 10308
1.8M 10307
7.6M 10277
8.5M 10263
7.1M 10251
7.9M 10130
1.7M 9901
8.2M 9899
8.3M 9883
41M 9836
7.8M 9746
8.6M 9730
42M 9643
8.4M 9606
8.0M 9528
8.8M 9352
43M 9316
9.3M 9301
8.1M 9288
1.6M 9280
9.6M 9262
8.9M 9066
1.3M 9049
53M 9022
9.1M 8762
9.2M 8692
9.0M 8627
45M 8463
44M 8462
47M 8327
46M 8216
49M 8201
48M 8187
9.4M 8031
9.5M 7939
9.8M 7925
9.9M 7726
9.7M 7681
51M 7628
50M 7480
1.2M 6882
54M 6711
55M 5888
1.1M 5821
58M 5588
57M 5356
56M 5319
62M 4715
60M 4671
59M 4631
61M 4369
63M 3826
64M 3559
66M 3520
10.0M 3513
68M 3421
65M 3412
67M 3242
73M 3208
69M 3042
71M 3038
70M 2990
72M 2856
74M 2721
77M 2574
75M 2483
79M 2477
78M 2417
80M 2391
76M 2360
1.0M 2303
91M 2270
94M 2181
84M 2155
98M 2148
81M 2146
83M 2109
82M 2069
85M 2016
88M 1910
95M 1910
90M 1879
87M 1864
89M 1861
86M 1856
99M 1818
92M 1753
93M 1745
96M 1721
97M 1693
100M 1586
147M 1130
101M 1089
149M 876
150M 869
151M 845
102M 844
148M 785
140M 759
103M 719
118M 597
104M 569
106M 560
152M 557
105M 548
107M 530
112M 493
110M 472
109M 450
108M 443
113M 430
114M 429
111M 419
116M 412
125M 409
201M 408
142M 403
121M 397
115M 389
122M 382
119M 369
153M 369
141M 345
117M 331
123M 330
124M 302
139M 289
120M 289
126M 284
135M 277
130M 271
129M 271
146M 267
128M 262
134M 257
145M 254
131M 246
137M 233
127M 230
136M 225
154M 223
133M 222
138M 219
132M 204
144M 194
143M 179
155M 134
156M 125
17k 108
157M 100
158M 94
588k 94
159M 92
21k 92
253k 90
29k 90
33k 90
163M 88
162M 86
34k 82
165M 81
160M 81
25k 79
45k 76
41k 75
218k 73
257k 73
180M 72
167M 72
256k 71
53k 71
241k 70
49k 70
214k 69
164M 69
217k 67
166M 67
27k 67
23k 66
230k 65
28k 64
106k 64
158k 64
173M 64
16k 64
66k 63
244k 63
86k 63
37k 63
169M 63
365k 63
161M 62
154k 61
222k 61
225k 61
165k 61
265k 60
122k 60
26k 59
237k 59
178k 59
171M 59
54k 59
32k 59
57k 58
254k 57
1,005k 57
58k 57
61k 56
194k 56
245k 56
960k 56
44k 56
168M 55
118k 54
46k 54
166k 54
169k 54
255k 54
227k 54
59k 54
24k 54
50k 54
226k 53
193M 53
894k 53
273k 53
947k 53
246k 53
308M 53
931k 53
924k 53
36k 53
249k 52
82k 52
782k 52
161k 52
210k 52
73k 51
1,009k 51
67k 51
130k 51
943k 51
966k 51
74k 51
234k 51
98k 51
229k 51
252k 51
198k 51
919k 51
999k 51
22k 51
141k 51
186k 51
157k 51
359k 51
261k 51
105k 51
188k 50
170M 50
52k 50
201k 50
151k 50
30k 50
78k 50
150k 50
20k 50
902k 50
69k 50
176M 50
820k 50
47k 50
996k 49
146k 49
1,004k 49
94k 49
110k 49
149k 49
224k 49
184k 49
258k 49
247k 48
242k 48
770k 48
101k 48
91k 48
1,022k 48
911k 48
1,012k 48
153k 48
932k 48
162k 48
68k 48
85k 48
206k 48
912k 47
31k 47
236k 47
174M 47
899k 47
215k 47
1,020k 47
142k 47
369k 47
126k 47
134k 47
185k 47
65k 47
950k 47
114k 47
1,023k 47
205k 47
990k 47
413k 46
360k 46
936k 46
97k 46
220k 46
788k 46
72k 46
885k 46
60k 46
197k 46
266k 46
514k 46
109k 46
211k 46
90k 46
861k 46
213k 45
250k 45
983k 45
39k 45
721k 45
156k 45
200k 45
974k 45
625k 45
223k 45
889k 45
906k 45
722k 45
107k 45
774k 45
172k 45
826k 45
856k 45
40k 45
976k 45
955k 45
282k 44
285k 44
676k 44
1,021k 44
212k 44
174k 44
221k 44
863k 44
434k 44
877k 44
238k 44
994k 44
193k 44
81k 44
791k 44
980k 44
64k 44
19k 44
968k 44
353k 44
270k 44
216k 44
83k 44
179M 43
997k 43
631k 43
190k 43
231k 43
1,011k 43
390k 43
882k 43
552k 43
75k 43
888k 43
35k 43
196k 43
1,008k 43
915k 43
297k 43
946k 43
937k 43
219k 43
240k 43
286k 43
87k 43
181k 43
38k 43
172M 43
89k 43
839k 43
233k 42
929k 42
177M 42
70k 42
1,018k 42
874k 42
963k 42
967k 42
841k 42
284k 42
202M 42
18k 42
790k 42
824k 42
55k 42
778k 42
138k 42
891k 42
182M 42
922k 42
954k 42
1,016k 42
232k 42
989k 42
177k 42
77k 42
952k 42
102k 42
178M 42
933k 41
113k 41
987k 41
334k 41
858k 41
926k 41
871k 41
927k 41
164k 41
917k 41
389k 41
934k 41
935k 41
274k 41
806k 41
843k 41
813k 41
160k 41
329k 41
43k 41
890k 40
80k 40
855k 40
433k 40
145k 40
362k 40
263k 40
930k 40
739k 40
939k 40
42k 40
799k 40
904k 40
825k 40
209k 40
876k 40
944k 40
1,000k 40
259k 40
367k 40
763k 40
925k 40
328k 40
779k 40
194M 40
1,014k 39
959k 39
916k 39
370k 39
692k 39
893k 39
63k 39
762k 39
182k 39
895k 39
755k 39
998k 39
786k 39
798k 39
277k 39
696k 39
326k 39
716k 39
589k 39
76k 39
437k 39
962k 39
796k 39
678k 39
886k 39
235k 39
730k 39
753k 39
239k 39
127k 39
243k 39
13k 39
1,001k 39
321k 39
941k 39
827k 39
985k 38
910k 38
879k 38
857k 38
898k 38
880k 38
406k 38
407k 38
281k 38
970k 38
168k 38
942k 38
708k 38
417k 38
386k 38
913k 38
147k 38
713k 38
181M 38
992k 38
278k 38
15k 38
191k 38
830k 38
385k 38
883k 38
48k 38
864k 38
1,006k 38
56k 37
746k 37
1,019k 37
969k 37
228k 37
984k 37
303k 37
1,007k 37
290k 37
907k 37
780k 37
938k 37
175k 37
981k 37
821k 37
361k 37
831k 37
850k 37
212M 37
975k 37
414k 37
526k 37
279k 37
51k 37
397k 37
965k 37
900k 37
409k 37
399k 37
862k 37
117k 37
405k 37
816k 37
810k 37
832k 37
410k 37
317k 37
837k 37
872k 37
836k 37
685k 36
323k 36
309k 36
62k 36
993k 36
875k 36
209M 36
597k 36
642k 36
884k 36
462k 36
964k 36
914k 36
314k 36
148k 36
100k 36
308k 36
446k 36
702k 36
873k 36
262k 36
865k 36
448k 36
421k 36
350k 36
373k 36
881k 36
357k 36
170k 36
199k 36
478k 36
973k 36
453k 36
743k 36
88k 36
757k 36
495k 36
393k 36
842k 36
184M 35
269k 35
188M 35
704k 35
742k 35
173k 35
554k 35
940k 35
853k 35
766k 35
849k 35
354k 35
267k 35
577k 35
505k 35
833k 35
383k 35
905k 35
187M 35
901k 35
651k 35
128k 35
189k 35
599k 35
956k 35
338k 35
835k 35
322k 35
972k 35
789k 35
445k 35
280k 35
767k 35
511k 35
958k 35
525k 35
364k 34
167k 34
371k 34
96k 34
977k 34
736k 34
287k 34
271k 34
187k 34
838k 34
1,017k 34
183k 34
690k 34
761k 34
921k 34
951k 34
509k 34
283k 34
815k 34
251k 34
687k 34
99k 34
516k 34
707k 34
394k 34
558k 34
95k 34
171k 34
844k 34
527k 34
568k 34
485k 34
918k 34
319k 34
620k 34
777k 34
129k 34
152k 34
995k 34
717k 34
300k 34
396k 34
920k 34
903k 34
928k 33
275k 33
208k 33
878k 33
953k 33
93k 33
466k 33
699k 33
748k 33
819k 33
712k 33
183M 33
342k 33
805k 33
332k 33
420k 33
641k 33
795k 33
897k 33
867k 33
706k 33
475k 33
431k 33
477k 33
268k 33
854k 33
523k 33
733k 33
812k 33
441k 33
807k 33
103k 33
986k 33
896k 33
618k 33
315k 33
737k 33
760k 33
440k 33
691k 33
276k 33
866k 33
460k 33
195k 33
646k 33
391k 32
677k 32
1,002k 32
612k 32
633k 32
828k 32
377k 32
575k 32
823k 32
814k 32
772k 32
312k 32
948k 32
543k 32
202k 32
594k 32
623k 32
808k 32
474k 32
851k 32
811k 32
330k 32
961k 32
652k 32
12k 32
412k 32
741k 32
192k 32
562k 32
775k 32
694k 32
784k 32
487k 32
1,015k 32
793k 32
785k 32
291k 32
800k 32
439k 32
1,003k 32
693k 32
204k 32
729k 32
465k 32
923k 32
531k 32
493k 32
754k 32
672k 32
859k 32
14k 31
176k 31
573k 31
870k 31
139k 31
727k 31
133k 31
957k 31
358k 31
331k 31
787k 31
868k 31
486k 31
908k 31
991k 31
629k 31
163k 31
738k 31
137k 31
621k 31
654k 31
348k 31
378k 31
802k 31
846k 31
159k 31
289k 31
776k 31
298k 31
979k 30
817k 30
724k 30
452k 30
769k 30
491k 30
834k 30
869k 30
688k 30
463k 30
978k 30
725k 30
92k 30
988k 30
343k 30
667k 30
718k 30
538k 30
419k 30
529k 30
132k 30
333k 30
301k 30
666k 30
503k 30
196M 30
180k 30
945k 30
542k 30
305k 30
428k 30
469k 30
108k 30
306k 30
310k 30
734k 30
711k 30
726k 30
497k 30
643k 30
892k 30
744k 30
198M 30
750k 30
84k 30
749k 30
829k 30
388k 30
522k 30
302k 30
566k 30
316k 30
887k 30
804k 29
768k 29
714k 29
438k 29
124k 29
546k 29
982k 29
647k 29
703k 29
840k 29
616k 29
747k 29
773k 29
644k 29
683k 29
430k 29
679k 29
745k 29
143k 29
490k 29
347k 29
735k 29
436k 29
293k 29
449k 29
622k 29
675k 29
504k 29
701k 29
155k 29
248k 29
203k 29
852k 29
189M 29
494k 29
636k 29
337k 29
592k 29
518k 29
627k 29
740k 29
272k 29
649k 29
586k 29
179k 29
719k 29
111k 29
548k 29
634k 29
395k 28
387k 28
560k 28
341k 28
457k 28
648k 28
423k 28
392k 28
535k 28
613k 28
818k 28
496k 28
794k 28
570k 28
640k 28
292k 28
550k 28
624k 28
545k 28
313k 28
700k 28
619k 28
381k 28
752k 28
638k 28
191M 28
705k 28
674k 28
318k 28
492k 28
299k 28
382k 28
671k 28
682k 28
125k 28
847k 28
324k 28
579k 28
374k 28
79k 28
467k 28
71k 27
783k 27
510k 27
598k 27
479k 27
720k 27
656k 27
481k 27
610k 27
426k 27
136k 27
400k 27
356k 27
115k 27
368k 27
375k 27
207k 27
574k 27
455k 27
422k 27
506k 27
500k 27
175M 27
346k 27
411k 27
473k 27
320k 27
195M 27
673k 27
192M 27
454k 27
697k 27
860k 27
408k 27
626k 27
401k 27
645k 27
628k 27
635k 27
351k 27
681k 27
848k 27
366k 27
602k 27
197M 26
140k 26
484k 26
845k 26
759k 26
585k 26
715k 26
551k 26
578k 26
432k 26
186M 26
534k 26
295k 26
710k 26
822k 26
536k 26
11k 26
402k 26
659k 26
530k 26
429k 26
680k 26
797k 26
686k 26
190M 26
425k 26
116k 26
363k 26
600k 26
653k 26
809k 26
471k 26
206M 26
294k 26
595k 25
480k 25
582k 25
1,010k 25
571k 25
403k 25
418k 25
695k 25
355k 25
517k 25
288k 25
949k 25
340k 25
424k 25
483k 25
639k 25
663k 25
771k 25
670k 25
615k 25
507k 25
260k 25
121k 25
971k 25
803k 25
521k 24
567k 24
404k 24
336k 24
563k 24
584k 24
601k 24
264k 24
698k 24
561k 24
781k 24
539k 24
398k 24
533k 24
614k 24
112k 24
658k 24
379k 24
758k 24
606k 24
120k 24
501k 24
416k 24
489k 24
660k 24
661k 24
731k 24
587k 24
541k 24
339k 24
664k 24
415k 24
553k 24
580k 24
450k 24
435k 23
131k 23
665k 23
581k 23
544k 23
593k 23
476k 23
765k 23
557k 23
384k 23
540k 23
458k 23
605k 23
519k 23
344k 23
123k 23
325k 23
655k 23
728k 23
427k 23
335k 23
572k 23
723k 23
144k 23
751k 23
1,013k 23
307k 23
609k 22
569k 22
689k 22
135k 22
617k 22
498k 22
537k 22
304k 22
459k 22
443k 22
792k 22
607k 22
591k 22
596k 22
909k 22
669k 22
547k 22
461k 22
604k 22
376k 22
528k 21
512k 21
472k 21
515k 21
520k 21
603k 21
470k 21
608k 21
311k 21
801k 21
499k 21
203M 21
104k 21
442k 21
502k 21
532k 21
207M 21
549k 21
488k 20
590k 20
662k 20
447k 20
185M 20
444k 20
508k 20
732k 20
555k 20
650k 20
565k 20
583k 20
468k 20
637k 20
630k 19
451k 19
556k 19
380k 19
352k 19
119k 19
482k 19
559k 19
611k 19
764k 19
684k 19
564k 19
576k 19
372k 18
235M 18
524k 18
456k 18
513k 18
709k 18
216M 18
215M 18
464k 18
632k 17
657k 17
205M 17
345k 17
1,024k 17
199M 17
218M 17
296k 17
204M 17
668k 17
200M 17
349k 17
10k 16
211M 15
214M 15
327k 15
213M 15
233M 14
756k 14
230M 13
255M 13
227M 12
210M 12
228M 12
242M 12
250M 11
256M 11
226M 11
208M 11
231M 11
243M 10
224M 10
237M 10
223M 10
220M 10
241M 9
244M 9
217M 9
234M 9
219M 9
238M 9
232M 9
287M 9
257M 8
249M 8
280M 8
1.1G 8
248M 8
565M 8
222M 8
221M 8
270M 8
225M 7
317M 7
246M 7
264M 7
253M 7
261M 7
245M 7
276M 7
332M 6
299M 6
236M 6
240M 6
321M 6
247M 6
229M 6
319M 6
262M 6
252M 5
251M 5
281M 5
298M 5
309M 5
239M 5
8.4k 5
6.8k 5
297M 5
6.4k 5
263M 5
258M 5
330M 4
300M 4
289M 4
8.9k 4
9.1k 4
293M 4
277M 4
310M 4
306M 4
355M 4
260M 4
269M 4
327M 4
9.6k 4
304M 4
339M 4
335M 4
567M 4
267M 4
338M 4
322M 4
285M 4
274M 4
303M 4
391M 3
448M 3
266M 3
390M 3
9.8k 3
9.7k 3
9.9k 3
272M 3
1.0G 3
445M 3
344M 3
286M 3
331M 3
353M 3
323M 3
315M 3
283M 3
8.5k 3
375M 3
291M 3
382M 3
422M 3
265M 3
275M 3
290M 3
360M 3
313M 3
4.7k 3
268M 3
314M 3
254M 3
278M 2
359M 2
6.1k 2
398M 2
656M 2
329M 2
7.8k 2
279M 2
354M 2
454M 2
564M 2
284M 2
292M 2
408M 2
6.3k 2
508M 2
843M 2
343M 2
460M 2
333M 2
618M 2
311M 2
9.5k 2
9.3k 2
405M 2
372M 2
340M 2
7.1k 2
288M 2
259M 2
745M 2
1.5G 2
9.0k 2
9.2k 2
377M 2
387M 2
295M 2
348M 2
294M 2
296M 2
510M 2
324M 2
273M 2
352M 2
337M 2
305M 2
409M 2
334M 2
406M 2
366M 2
566M 2
467M 2
369M 1
465M 1
396M 1
896M 1
468M 1
810M 1
7.7k 1
570M 1
404M 1
415M 1
705M 1
302M 1
373M 1
590M 1
646M 1
839M 1
397M 1
869M 1
769M 1
301M 1
488M 1
692M 1
611M 1
593M 1
527M 1
424M 1
503M 1
866M 1
440M 1
461M 1
365M 1
431M 1
349M 1
581M 1
962M 1
470M 1
541M 1
799M 1
633M 1
5.1k 1
910M 1
679M 1
342M 1
370M 1
532M 1
3.2k 1
725M 1
442M 1
737M 1
691M 1
914M 1
394M 1
700M 1
356M 1
712M 1
5.3k 1
568M 1
830M 1
519M 1
8.3k 1
580M 1
977M 1
959M 1
981M 1
526M 1
379M 1
623M 1
533M 1
619M 1
521M 1
429M 1
744M 1
844M 1
889M 1
720M 1
6.2k 1
996M 1
371M 1
282M 1
437M 1
447M 1
497M 1
643M 1
456M 1
493M 1
414M 1
925M 1
645M 1
652M 1
420M 1
383M 1
312M 1
919M 1
904M 1
595M 1
485M 1
900M 1
361M 1
345M 1
7.2k 1
895M 1
954M 1
490M 1
3.4k 1
603M 1
1,006M 1
706M 1
509M 1
928M 1
320M 1
3.3k 1
4.6k 1
531M 1
364M 1
722M 1
501M 1
985M 1
412M 1
1,020M 1
841M 1
576M 1
690M 1
832M 1
10.0k 1
328M 1
818M 1
953M 1
6.9k 1
544M 1
426M 1
681M 1
347M 1
5.8k 1
606M 1
940M 1
271M 1
765M 1
664M 1
649M 1
411M 1
680M 1
514M 1
639M 1
963M 1
421M 1
457M 1
381M 1
318M 1
878M 1
351M 1
578M 1
868M 1
495M 1
935M 1
363M 1
518M 1
762M 1
491M 1
676M 1
684M 1
579M 1
550M 1
407M 1
591M 1
418M 1
7.4k 1
346M 1
8.7k 1
784M 1
385M 1
7.6k 1
512M 1
Name: Size, dtype: int64
We have a really big list to show, so we need to be careful about how much computer power we use when we show results, because our dataset is pretty big.
There are several unique values in the `size` column, we have to first make the unit into one common unit from M and K to bytes, and then remove the `M` and `K` from the values and convert them into numeric data type.
Let’s check how many values are in megabyte ‘M’ in it
# find the values in size column which has 'M' in it
df['Size'].loc[df['Size'].str.contains('M')].value_counts().sum()
{
“name”: “ValueError”,
“message”: “Cannot mask with non-boolean array containing NA / NaN values”,
“stack”: “—————————————————————————
ValueError Traceback (most recent call last)
~\AppData\Local\Temp\ipykernel_10400\1502233449.py in
1 # find the values in size column which has ‘M’ in it
—-> 2 df[‘Size’].loc[df[‘Size’].str.contains(‘M’)].value_counts().sum()
c:\Users\ak\AppData\Local\miniconda3\envs\python_eda\lib\site-packages\pandas\core\indexing.py in getitem(self, key)
929
930 maybe_callable = com.apply_if_callable(key, self.obj)
–> 931 return self._getitem_axis(maybe_callable, axis=axis)
932
933 def _is_scalar_access(self, key: tuple):
c:\Users\ak\AppData\Local\miniconda3\envs\python_eda\lib\site-packages\pandas\core\indexing.py in _getitem_axis(self, key, axis)
1141 self._validate_key(key, axis)
1142 return self._get_slice_axis(key, axis=axis)
-> 1143 elif com.is_bool_indexer(key):
1144 return self._getbool_axis(key, axis=axis)
1145 elif is_list_like_indexer(key):
c:\Users\ak\AppData\Local\miniconda3\envs\python_eda\lib\site-packages\pandas\core\common.py in is_bool_indexer(key)
137 # Don’t raise on e.g. [\”A\”, \”B\”, np.nan], see
138 # test_loc_getitem_list_of_labels_categoricalindex_with_na
–> 139 raise ValueError(na_msg)
140 return False
141 return True
ValueError: Cannot mask with non-boolean array containing NA / NaN values”
}
We’re getting an error because there are some missing values in our data. So, first, we need to fix these missing values before we can work on the ‘size’ column.
# Code to check and display the count of missing values in each column, sorted in descending order
df.isnull().sum().sort_values(ascending=False)
Developer Website 760835
Privacy Policy 420953
Released 71053
Rating 22883
Rating Count 22883
Minimum Android 6530
Size 196
Currency 135
Installs 107
Minimum Installs 107
Developer Id 33
Developer Email 31
App Name 2
App Id 0
Price 0
Free 0
Maximum Installs 0
Last Updated 0
Content Rating 0
Category 0
Ad Supported 0
In App Purchases 0
Editors Choice 0
Scraped Time 0
dtype: int64
We can visualize missing values through heatmap.
# Create a heatmap to visualize missing values
plt.rcParams['figure.figsize'] = (15,6)
sns.heatmap(df.isnull(), yticklabels=False, cbar=False, cmap='viridis')
plt.title("Distribution of Missing Values")
plt.show()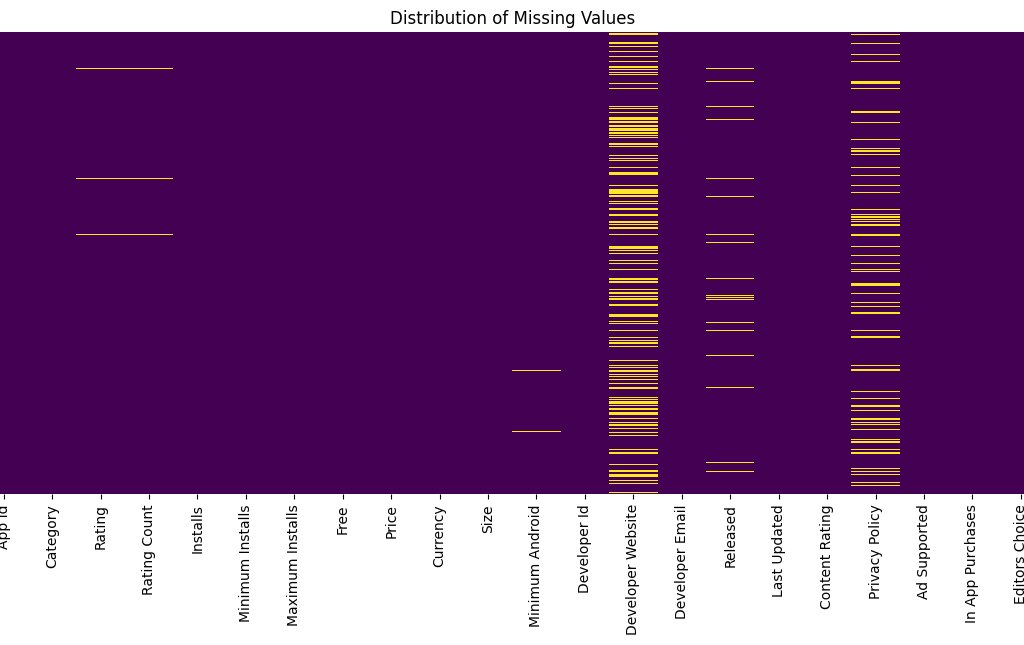
Let’s check what percentage of our data is missing.
#df.isnull().sum()/len(df)*100
missing_percentage = (df.isnull().sum().sort_values(ascending = False)/len(df))*100
missing_percentage
Developer Website 32.894657
Privacy Policy 18.199879
Released 3.071972
Rating 0.989345
Rating Count 0.989345
Minimum Android 0.282324
Size 0.008474
Currency 0.005837
Installs 0.004626
Minimum Installs 0.004626
Developer Id 0.001427
Developer Email 0.001340
App Name 0.000086
App Id 0.000000
Price 0.000000
Free 0.000000
Maximum Installs 0.000000
Last Updated 0.000000
Content Rating 0.000000
Category 0.000000
Ad Supported 0.000000
In App Purchases 0.000000
Editors Choice 0.000000
Scraped Time 0.000000
dtype: float64
Developer Website has the highest percentage of null values (32.89%).
Privacy Policy shows significant null values (18.19%).
Released has approximately 3.07% null values.
Rating and Rating Count both have 0.98% null values.
Minimum Android has 0.28% null values.
Currency have low null values (around 0.005%).
Installs, Minimum Installs, and Currency have very low null values (around 0.004%).
Remaining features (Developer Email, Developer Id, Size, App Name) have extremely low null values (less than 0.001%).
To make things simpler and less sentimental, I’ve chosen to delete the following columns: ‘Developer Website’, ‘Privacy Policy’, ‘Developer Email’, ‘In App Purchases’, ‘Editors Choice’, ‘Ad Supported’, and ‘Scraped Time’.
# Columns to remove
columns_to_remove = ['Developer Website', 'Privacy Policy', 'Developer Email',
                      'In App Purchases', 'Editors Choice', 'Ad Supported', 'Scraped Time']

# Drop the specified columns in-place
df.drop(columns=columns_to_remove, axis=1, inplace=True)

df.head()| App Name | App Id | Category | Rating | Rating Count | Installs | Minimum Installs | Maximum Installs | Free | Price | Currency | Size | Minimum Android | Developer Id | Released | Last Updated | Content Rating | |
|---|---|---|---|---|---|---|---|---|---|---|---|---|---|---|---|---|---|
| 0 | Gakondo | com.ishakwe.gakondo | Adventure | 0.0 | 0.0 | 10+ | 10.0 | 15 | True | 0.0 | USD | 10M | 7.1 and up | Jean Confident Irénée NIYIZIBYOSE | Feb 26, 2020 | Feb 26, 2020 | Everyone |
| 1 | Ampere Battery Info | com.webserveis.batteryinfo | Tools | 4.4 | 64.0 | 5,000+ | 5000.0 | 7662 | True | 0.0 | USD | 2.9M | 5.0 and up | Webserveis | May 21, 2020 | May 06, 2021 | Everyone |
| 2 | Vibook | com.doantiepvien.crm | Productivity | 0.0 | 0.0 | 50+ | 50.0 | 58 | True | 0.0 | USD | 3.7M | 4.0.3 and up | Cabin Crew | Aug 9, 2019 | Aug 19, 2019 | Everyone |
| 3 | Smart City Trichy Public Service Vehicles 17UC… | cst.stJoseph.ug17ucs548 | Communication | 5.0 | 5.0 | 10+ | 10.0 | 19 | True | 0.0 | USD | 1.8M | 4.0.3 and up | Climate Smart Tech2 | Sep 10, 2018 | Oct 13, 2018 | Everyone |
| 4 | GROW.me | com.horodyski.grower | Tools | 0.0 | 0.0 | 100+ | 100.0 | 478 | True | 0.0 | USD | 6.2M | 4.1 and up | Rafal Milek-Horodyski | Feb 21, 2020 | Nov 12, 2018 | Everyone |
For the ‘Released’ column, which is crucial for app release dates, we’ve decided to fill in any missing values using the mode.
Using the mode, which is the most common date, is a good option for filling in missing values in categorical date data.
This ensures that we fill in missing values with the most common release date, helping to keep our data complete.
# Impute missing values in 'Released' column with the mode
released_mode = df['Released'].mode()[0]
df['Released'].fillna(released_mode, inplace=True)
To handle missing values in ‘Rating’ and ‘Rating Count,’ we opt for the median because it accurately reflects the middle value, aligning with the existing data pattern. This approach helps balance out extreme values, ensuring trustworthy outcomes.
# Impute missing values in 'Rating' and 'Rating Count' columns with the median
df['Rating'].fillna(df['Rating'].median(), inplace=True)
df['Rating Count'].fillna(df['Rating Count'].median(), inplace=True)
Now, let’s check for missing values again to make sure we’ve handled them properly.
df.isnull().sum().sort_values(ascending=False)Minimum Android 6530
Size 196
Currency 135
Installs 107
Minimum Installs 107
Developer Id 33
App Name 2
Last Updated 0
Released 0
Free 0
Price 0
App Id 0
Maximum Installs 0
Rating Count 0
Rating 0
Category 0
Content Rating 0
dtype: int64
To handle missing values in ‘Installs’ and ‘Minimum Installs’ we opt for the median because it accurately reflects the middle value, aligning with the existing data pattern. This approach helps balance out extreme values, ensuring trustworthy outcomes.
# Check the data type of 'Minimum Installs' and convert if needed
if df['Minimum Installs'].dtype == 'object':
    df['Minimum Installs'] = df['Minimum Installs'].str.replace(',', '').str.extract('(\d+)').astype(float)

# Impute missing values with median
df['Minimum Installs'].fillna(df['Minimum Installs'].median(), inplace=True)
# Convert categorical values to numeric for 'Installs' column if it's in object format
if df['Installs'].dtype == 'object':
df['Installs'] = df['Installs'].str.replace(',', '').str.extract('(\d+)').astype(float)
# Impute missing values with median
df['Installs'].fillna(df['Installs'].median(), inplace=True) Now, let’s check for missing values again
df.isnull().sum().sort_values(ascending=False)Minimum Android 6530
Size 196
Currency 135
Developer Id 33
App Name 2
Price 0
Last Updated 0
Released 0
Free 0
App Id 0
Maximum Installs 0
Minimum Installs 0
Installs 0
Rating Count 0
Rating 0
Category 0
Content Rating 0
dtype: int64
Removing missing values guarantees that our data is complete, reliable, and accurate for analysis. This process ensures that important columns have all the necessary information, reduces the chance of biased results, and provides dependable data for making informed decisions.
# Drop all missing values in specific columns
# df.dropna(subset=['Minimum Android', 'Size', 'Currency', 'App Name','Developer Id'], inplace=True)
df.dropna(subset=['Minimum Android', 'Size', 'Currency', 'Developer Id', 'App Name'], inplace=True)
Let’s check if we have any missing values remaining
df.isnull().sum().sort_values(ascending=False)App Name 0
Price 0
Last Updated 0
Released 0
Developer Id 0
Minimum Android 0
Size 0
Currency 0
Free 0
App Id 0
Maximum Installs 0
Minimum Installs 0
Installs 0
Rating Count 0
Rating 0
Category 0
Content Rating 0
dtype: int64
Because we successfully imputed all missing values so now we once again go to ‘size’ column and check how many values are in megabyte ‘M’ in it
# find the values in size column which has 'M' in it
df['Size'].loc[df['Size'].str.contains('M')].value_counts().sum()
2195318
# find the values in size column which has 'k' in it
df['Size'].loc[df['Size'].str.contains('k')].value_counts().sum()
36130
# find the values in size column which has 'Varies with device' in it
df['Size'].loc[df['Size'].str.contains('Varies with device')].value_counts().sum()
74588
# find the values in size column which has 'Varies with device' in it
df['Size'].loc[df['Size'].str.contains('G')].value_counts().sum()
13
We have 2195318 values in ‘M’ units
We have 36130 values in ‘k’ units
We have 74588 value in Varies with device
We have 13 values in ‘G’ units
Let’s convert the ‘G’ , ‘M’ and ‘k’ units into bytes and then remove the ‘G’ , ‘M’ and ‘k’ from the values and convert them into numeric data type.
# convert the size column to numeric by multiplying the values with 1024 if it has 'k' in it and 1024*1024 if it has 'M' in it
# this function will convert the size column to numeric
def convert_size(size):
    # add function details here
    '''
    This function will convert the size column to numeric by multiplying the values with 1024 if it has 'k' in it and 1024*1024 if it has 'M' in it
    '''

    if isinstance(size, str):
        # Remove commas from the string
        size = size.replace(',', '')
        if 'k' in size:
            return float(size.replace('k', '')) * 1024
        elif 'M' in size:
            return float(size.replace('M', '')) * 1024 * 1024
        elif 'G' in size:
            return float(size.replace('G', '')) * 1024 * 1024 * 1024
        elif 'Varies with device' in size:
            return np.nan
    return size

df['Size'] = df['Size'].apply(convert_size)
# rename the column name 'Size' to 'Size_in_bytes'
df.rename(columns={'Size': 'Size_in_bytes'}, inplace=True)Let’s replace the missing values of ‘Varies with device’ with 0.
df['Size_in_bytes'].fillna(0, inplace=True)Let’s display current info of Data Frame
df.info()
Int64Index: 2306049 entries, 0 to 2312943
Data columns (total 17 columns):
# Column Dtype
— —— —–
0 App Name object
1 App Id object
2 Category object
3 Rating float64
4 Rating Count float64
5 Installs float64
6 Minimum Installs float64
7 Maximum Installs int64
8 Free bool
9 Price float64
10 Currency object
11 Size_in_bytes float64
12 Minimum Android object
13 Developer Id object
14 Released object
15 Last Updated object
16 Content Rating object
dtypes: bool(1), float64(6), int64(1), object(9)
memory usage: 301.3+ MB
Let’s make a new column called ‘Size in Mb’ which will have the size in MB
# making a new column called 'Size in Mb' which will have the size in MB
df['Size_in_Mb'] = df['Size_in_bytes'].apply(lambda x: x/(1024*1024))df.head()| App Name | App Id | Category | Rating | Rating Count | Installs | Minimum Installs | Maximum Installs | Free | Price | Currency | Size_in_bytes | Minimum Android | Developer Id | Released | Last Updated | Content Rating | Size_in_Mb | |
|---|---|---|---|---|---|---|---|---|---|---|---|---|---|---|---|---|---|---|
| 0 | Gakondo | com.ishakwe.gakondo | Adventure | 0.000 | 0.000 | 10.000 | 10.000 | 15 | True | 0.000 | USD | 10485760.000 | 7.1 and up | Jean Confident Irénée NIYIZIBYOSE | Feb 26, 2020 | Feb 26, 2020 | Everyone | 10.000 |
| 1 | Ampere Battery Info | com.webserveis.batteryinfo | Tools | 4.400 | 64.000 | 5000.000 | 5000.000 | 7662 | True | 0.000 | USD | 3040870.400 | 5.0 and up | Webserveis | May 21, 2020 | May 06, 2021 | Everyone | 2.900 |
| 2 | Vibook | com.doantiepvien.crm | Productivity | 0.000 | 0.000 | 50.000 | 50.000 | 58 | True | 0.000 | USD | 3879731.200 | 4.0.3 and up | Cabin Crew | Aug 9, 2019 | Aug 19, 2019 | Everyone | 3.700 |
| 3 | Smart City Trichy Public Service Vehicles 17UC… | cst.stJoseph.ug17ucs548 | Communication | 5.000 | 5.000 | 10.000 | 10.000 | 19 | True | 0.000 | USD | 1887436.800 | 4.0.3 and up | Climate Smart Tech2 | Sep 10, 2018 | Oct 13, 2018 | Everyone | 1.800 |
| 4 | GROW.me | com.horodyski.grower | Tools | 0.000 | 0.000 | 100.000 | 100.000 | 478 | True | 0.000 | USD | 6501171.200 | 4.1 and up | Rafal Milek-Horodyski | Feb 21, 2020 | Nov 12, 2018 | Everyone | 6.200 |
df.columnsIndex([‘App Name’, ‘App Id’, ‘Category’, ‘Rating’, ‘Rating Count’, ‘Installs’,
‘Minimum Installs’, ‘Maximum Installs’, ‘Free’, ‘Price’, ‘Currency’,
‘Size_in_bytes’, ‘Minimum Android’, ‘Developer Id’, ‘Released’,
‘Last Updated’, ‘Content Rating’, ‘Size_in_Mb’],
dtype=’object’)
Now that our processed dataset is free of missing values, you can skip part 1 of this notebook and proceed directly with the cleaned dataset of Google Play Store apps. You can download this dataset from the link.
Import Libraries
import pandas as pd  # Data manipulation and analysis library
import numpy as np   # Numerical computing library

# Visualization Libraries
import matplotlib.pyplot as plt  # Data visualization library
import seaborn as sns            # Statistical data visualization library
%matplotlib inline
# Load the Dataset
df = pd.read_csv('./Data/google_play_store_cleaned.csv')Now, we’re ready to explore various questions using the dataset.
Q1. How many apps in this dataset have duplicate names?
# Find the duplicate in 'App Name' column
duplicate_app_names = df['App Name'].duplicated().sum()

print(f"There are total {duplicate_app_names} apps in dataset with duplicate names")
There are total 134549 apps in dataset with duplicate names
Q2. Please show number count of App Names
df['App Name'].value_counts().sort_values(ascending=False)Tic Tac Toe 382
Calculator 260
Flashlight 256
BMI Calculator 199
Age Calculator 190
…
Trident Suvidha-Sales 1
My Office Solution 1
Dominoes BIG 1
Telesistema 1
Biliyor Musun – Sonsuz Yarış 1
Name: App Name, Length: 2171500, dtype: int64
Q3. Please display Apps having name Age Calculator
df[df['App Name'] == 'Age Calculator']| App Name | App Id | Category | Rating | Rating Count | Installs | Minimum Installs | Maximum Installs | Free | Price | Currency | Size_in_bytes | Minimum Android | Developer Id | Released | Last Updated | Content Rating | Size_in_Mb | |
|---|---|---|---|---|---|---|---|---|---|---|---|---|---|---|---|---|---|---|
| 3337 | Age Calculator | com.jawad.agecalculator | Tools | 4.9 | 83.0 | 500.0 | 500.0 | 536 | True | 0.00 | USD | 5347737.6 | 4.4 and up | Mobix Tech | May 12, 2020 | Jun 18, 2020 | Everyone | 5.100000 |
| 4630 | Age Calculator | com.andywebsoft.agecalculator | Productivity | 4.5 | 53.0 | 10000.0 | 10000.0 | 11228 | True | 0.00 | USD | 644096.0 | 2.3 and up | NSTechFrame | Jan 2, 2015 | Feb 12, 2015 | Everyone | 0.614258 |
| 23583 | Age Calculator | com.age46.agecalculator | Tools | 4.7 | 22.0 | 1000.0 | 1000.0 | 1795 | True | 0.00 | USD | 3460300.8 | 2.3.3 and up | PureSoft | Feb 28, 2015 | Mar 06, 2015 | Everyone | 3.300000 |
| 37176 | Age Calculator | com.zakasoft.myage | Tools | 4.1 | 9.0 | 1000.0 | 1000.0 | 2311 | True | 0.00 | USD | 4718592.0 | 4.4 and up | Zakaria Bin Abdur Rouf | Sep 26, 2017 | Dec 30, 2020 | Everyone | 4.500000 |
| 40793 | Age Calculator | com.codedonor.agecalculator | Personalization | 0.0 | 0.0 | 1000.0 | 1000.0 | 1431 | True | 0.00 | USD | 1258291.2 | 4.0.3 and up | Proud Indian Studio | Jun 12, 2016 | Jun 12, 2016 | Everyone | 1.200000 |
| … | … | … | … | … | … | … | … | … | … | … | … | … | … | … | … | … | … | … |
| 2218411 | Age Calculator | com.ab.agecalculator | Tools | 0.0 | 0.0 | 50.0 | 50.0 | 63 | True | 0.00 | USD | 2621440.0 | 5.0 and up | Arjun Bhatt | Dec 14, 2019 | Dec 17, 2019 | Everyone | 2.500000 |
| 2223414 | Age Calculator | com.lightofray.agecalculator | Tools | 5.0 | 8.0 | 100.0 | 100.0 | 359 | True | 0.00 | USD | 3460300.8 | 5.0 and up | Light Of Rays | May 10, 2020 | Dec 26, 2020 | Everyone | 3.300000 |
| 2279447 | Age Calculator | com.kaushaldalvi.agecalcadfree | Tools | 4.4 | 8.0 | 100.0 | 100.0 | 175 | False | 0.99 | USD | 3145728.0 | 2.3.3 and up | Kaushal Dalvi | Feb 25, 2011 | Feb 11, 2014 | Everyone | 3.000000 |
| 2284793 | Age Calculator | com.rudranetra.agecalculator | Tools | 0.0 | 0.0 | 10.0 | 10.0 | 29 | True | 0.00 | USD | 4194304.0 | 5.0 and up | Rudra Netra | Nov 26, 2020 | Dec 01, 2020 | Everyone | 4.000000 |
| 2296223 | Age Calculator | in.accountmaster.agecalculator | Entertainment | 4.4 | 123.0 | 5000.0 | 5000.0 | 9580 | True | 0.00 | USD | 3250585.6 | 4.0.3 and up | www.confodeal.com | Mar 17, 2016 | Sep 28, 2016 | Everyone | 3.100000 |
190 rows × 18 columns
Q4. How many different app prices are there in this dataset?
diff_app_prices = df['Price'].nunique()

print(f"There are total {diff_app_prices} different prices of apps")
There are total 1061 different prices of apps
Q5. How many free apps are there in this dataset?
total_free_apps = df['Free'].value_counts()[True]

print(f"There are total {total_free_apps} free apps in this dataset")
There are total 2261395 free apps in this dataset
Q6. How many paid apps are there in this dataset?
total_paid_apps = df['Free'].value_counts()[False]

print(f"There are total {total_paid_apps} paid apps in this dataset")
There are total 44654 paid apps in this dataset
Q7. What is the predominant content rating for most apps?
df['Content Rating'].value_counts()Everyone 2015931
Teen 195942
Mature 17+ 60127
Everyone 10+ 33761
Unrated 154
Adults only 18+ 134
Name: Content Rating, dtype: int64
Q8. Please show me 10 sample apps data?
df.sample(10)| App Name | App Id | Category | Rating | Rating Count | Installs | Minimum Installs | Maximum Installs | Free | Price | Currency | Size_in_bytes | Minimum Android | Developer Id | Released | Last Updated | Content Rating | Size_in_Mb | |
|---|---|---|---|---|---|---|---|---|---|---|---|---|---|---|---|---|---|---|
| 1735032 | Radios Mexico | com.redeliteapps.radiosmexico | Music & Audio | 0.0 | 0.0 | 100.0 | 100.0 | 359 | True | 0.0 | USD | 26214400.0 | 4.0.3 and up | Redelite apps | Oct 14, 2019 | Oct 14, 2019 | Everyone | 25.0 |
| 379071 | GetRunner Runner – Earn Extra Income Easily | com.getrunner.driver.application | Productivity | 4.6 | 9.0 | 100.0 | 100.0 | 480 | True | 0.0 | USD | 12582912.0 | 5.0 and up | GetMove Sdn. Bhd. | Jun 17, 2020 | Jun 02, 2021 | Everyone | 12.0 |
| 74353 | The ResilientMind | com.myoutcomes.resilentmind | Health & Fitness | 0.0 | 0.0 | 100.0 | 100.0 | 110 | True | 0.0 | USD | 34603008.0 | 4.2 and up | MyOutcomes For Mental Well Being Inc. | Jun 26, 2020 | May 26, 2021 | Everyone | 33.0 |
| 708217 | Pak Independence Photo Frames | com.happy.independence.day.photo.frames | Photography | 4.7 | 757.0 | 100000.0 | 100000.0 | 466187 | True | 0.0 | USD | 11534336.0 | 4.0.3 and up | finkyfour | Jul 30, 2016 | Feb 20, 2020 | Everyone | 11.0 |
| 1840075 | BICC 2020 | org.oncologyclub.bicc2020 | Events | 0.0 | 0.0 | 10.0 | 10.0 | 10 | True | 0.0 | USD | 3670016.0 | 4.4 and up | Shahadat Rigun | Feb 14, 2020 | Feb 14, 2020 | Everyone | 3.5 |
| 897130 | Mitsubishi TV Remote | com.tvremoteapp.mitsubishitvremote | Tools | 3.6 | 65.0 | 10000.0 | 10000.0 | 12914 | True | 0.0 | USD | 14680064.0 | 4.4 and up | Just Remote Control | Mar 8, 2020 | Mar 27, 2021 | Everyone | 14.0 |
| 1943772 | The Urban Chic Boutique | com.shoptheurbanchic | Shopping | 5.0 | 9.0 | 10.0 | 10.0 | 30 | True | 0.0 | USD | 39845888.0 | 5.0 and up | Rapid Acceleration Partners | Apr 11, 2021 | Apr 11, 2021 | Everyone | 38.0 |
| 1076004 | Lumbung Budaya Jogja | org.btkpdiy.lumbungbudayajogja | Education | 4.3 | 36.0 | 1000.0 | 1000.0 | 1864 | True | 0.0 | USD | 8178892.8 | 4.1 and up | Balai Tekkomdik Dinas Dikpora DIY | Sep 9, 2015 | Sep 10, 2015 | Everyone | 7.8 |
| 290693 | German Operation Luttich 1944 (turn-limit) | com.cloudworth.falaiseg_free | Strategy | 4.1 | 13.0 | 1000.0 | 1000.0 | 1251 | True | 0.0 | USD | 1258291.2 | 4.1 and up | Joni Nuutinen | Jul 12, 2019 | May 05, 2021 | Everyone 10+ | 1.2 |
| 1662068 | Hair Style Salon Photo Editor | com.VAD.Hair.Style.Salon.Photo.Editor | Photography | 2.7 | 1101.0 | 500000.0 | 500000.0 | 688789 | True | 0.0 | USD | 16777216.0 | 4.4 and up | Virtual Art Design | Jul 11, 2016 | Apr 24, 2019 | Everyone | 16.0 |
Q9. Does this dataset contain any duplicate rows?
# Find duplicates in the data
dup_rows_in_df = df.duplicated().sum()

print(f"There are total {dup_rows_in_df} duplicate rows in this dataset")
There are total 0 duplicate rows in this dataset
Q10. Please display the top 20 app categories ranked by their installation counts.?
To address this question, we’ll need to take some additional steps:
Convert the ‘Installs’ column into integers
Some apps have a value of -2147483648 in the ‘Installs’ column, which Google doesn’t want to display. We need to replace this value with the maximum value.
# Convert 'Installs' column to integer
df['Installs'] = df['Installs'].astype(int)
# Find the maximum value in the 'Installs' column
max_installs = df['Installs'].max()
# Replace '-2147483648' with the maximum value
df['Installs'].replace(-2147483648, max_installs, inplace=True)
top_20_categories_df = df.groupby('Category')['Installs'].nlargest(1)
print(top_20_categories_df)
Category
Action 57901 500000000
Adventure 25699 100000000
Arcade 785381 1000000000
Art & Design 578576 100000000
Auto & Vehicles 1623195 1000000000
Beauty 2204384 50000000
Board 1769868 500000000
Books & Reference 489887 1000000000
Business 1852547 1000000000
Card 769499 100000000
Casino 480340 50000000
Casual 285457 1000000000
Comics 1155395 50000000
Communication 352159 1000000000
Dating 1846598 100000000
Education 121984 100000000
Educational 335841 100000000
Entertainment 36844 1000000000
Events 395464 10000000
Finance 266378 100000000
Food & Drink 980170 100000000
Health & Fitness 187863 1000000000
House & Home 2225953 50000000
Libraries & Demo 2098884 50000000
Lifestyle 89747 500000000
Maps & Navigation 1205130 500000000
Medical 54453 10000000
Music 220344 100000000
Music & Audio 959700 1000000000
News & Magazines 415321 1000000000
Parenting 322287 10000000
Personalization 1429190 1000000000
Photography 52306 1000000000
Productivity 15825 1000000000
Puzzle 27854 100000000
Racing 1914941 500000000
Role Playing 498916 100000000
Shopping 2138397 500000000
Simulation 38146 100000000
Social 64838 1000000000
Sports 2062301 500000000
Strategy 422719 500000000
Tools 336834 1000000000
Travel & Local 495078 1000000000
Trivia 1398872 100000000
Video Players & Editors 167269 1000000000
Weather 1597264 500000000
Word 1827693 100000000
Name: Installs, dtype: int32
For easier comprehension, let’s plot the top ten categories.
top_10_categories_df = df.groupby('Category')['Installs'].sum().nlargest(10).reset_index()

# Create the bar plot
plt.figure(figsize=(14, 6))
sns.barplot(data=top_10_categories_df, x='Category', y='Installs', palette="plasma")
plt.ylabel('Total Installs')
plt.xlabel('Category')
plt.title('Top 10 Categories with Highest Total Installs')
plt.xticks(rotation=45, ha='right', fontsize=10)
plt.tight_layout()
plt.show()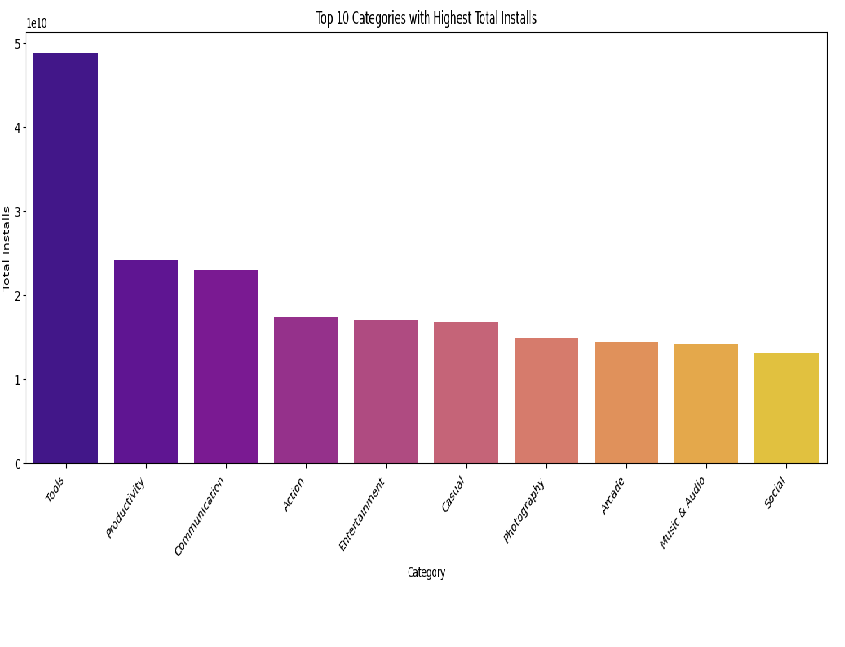
According to this plot, the Tools category has the highest number of installs.
Q11. Please present the top 10 app categories with the highest average ratings?
# Category with highest average Rating
top_10_categories_highest_avg_rating = df.groupby('Category')['Rating'].mean().sort_values(ascending=False).head(10)
# Print the result
print(top_10_categories_highest_avg_rating)
Category
Role Playing 3.372444
Casino 3.279506
Simulation 3.206113
Weather 3.121011
Card 3.087922
Racing 2.961094
Video Players & Editors 2.904680
Word 2.902717
Strategy 2.886392
Comics 2.869888
Name: Rating, dtype: float64
Q12. Please display the average price of apps across different categories?
# Group by category and calculate the mean price
average_price_by_category = df.groupby('Category')['Price'].mean().reset_index()

# Print the average price of apps in each category
print(average_price_by_category)
Category Price0 Action 0.066630
1 Adventure 0.180010
2 Arcade 0.096587
3 Art & Design 0.088625
4 Auto & Vehicles 0.116687
5 Beauty 0.005154
6 Board 0.170242
7 Books & Reference 0.193293
8 Business 0.056066
9 Card 0.130445
10 Casino 0.071434
11 Casual 0.048496
12 Comics 0.053878
13 Communication 0.042648
14 Dating 0.084517
15 Education 0.163200
16 Educational 0.171233
17 Entertainment 0.050822
18 Events 0.003468
19 Finance 0.052118
20 Food & Drink 0.020124
21 Health & Fitness 0.098702
22 House & Home 0.019028
23 Libraries & Demo 0.041754
24 Lifestyle 0.075994
25 Maps & Navigation 0.145898
26 Medical 0.713524
27 Music 0.063404
28 Music & Audio 0.042218
29 News & Magazines 0.006752
30 Parenting 0.070506
31 Personalization 0.107757
32 Photography 0.063086
33 Productivity 0.133512
34 Puzzle 0.086171
35 Racing 0.033536
36 Role Playing 0.311013
37 Shopping 0.008316
38 Simulation 0.109991
39 Social 0.040037
40 Sports 0.226809
41 Strategy 0.223534
42 Tools 0.147121
43 Travel & Local 0.073947
44 Trivia 0.031840
45 Video Players & Editors 0.122761
46 Weather 0.146946
47 Word 0.099919
To enhance understanding, let’s graph the average prices of apps in each category.
# Calculate the average price of apps in each category using groupby
average_price_by_category = df.groupby('Category')['Price'].mean()

# Plotting the average prices across categories
plt.figure(figsize=(12, 6))
average_price_by_category.sort_values(ascending=False).plot(kind='bar', color='blue')
plt.xlabel('App Category')
plt.ylabel('Average Price')
plt.title('Average App Prices Across Categories')
plt.show()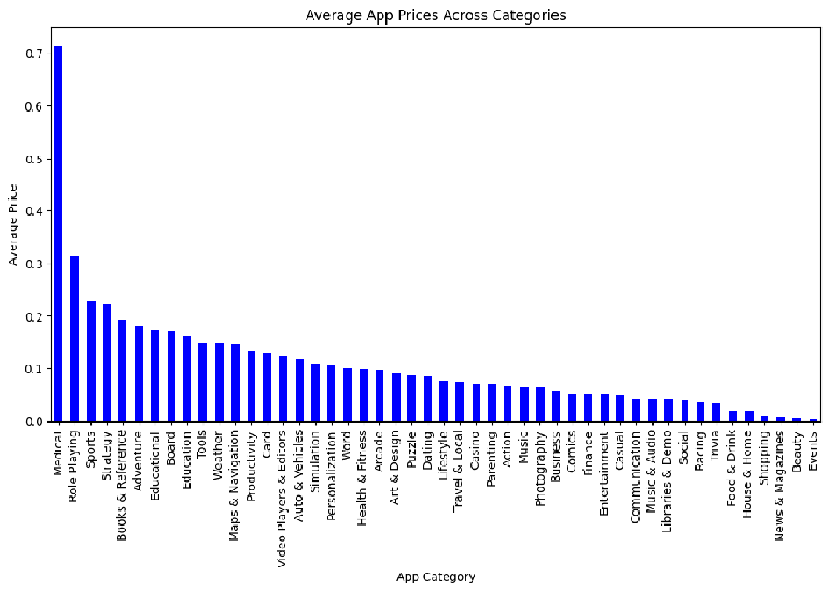
According to this plot highest average prices of apps are in Medical category.
Q13. Please show me the top 10 app developers along with the number of apps they have developed?
# Count the number of apps produced by each developer
top_10_developers = df['Developer Id'].value_counts().head(10)

# Print the result
print("Top 10 app-producing developers:")
print(top_10_developers)
Top 10 app-producing developers:
Subsplash Inc 5422
TRAINERIZE 5153
ChowNow 4865
OrderYOYO 2884
Phorest 2821
BH App Development Ltd 2453
Sharefaith 2077
Flipdish 1969
J&M Studio 1942
CyJ Studio 1741
Name: Developer Id, dtype: int64
Q14. Which Android version is most prevalent among top-rated apps?
# Most common Android version among top-rated apps
top_rated_apps = df[df['Rating'] >= 4.5]
most_common_android_version = top_rated_apps.groupby('Minimum Android')['App Name'].count().idxmax()
print(f"The most common Android version among top-rated apps is: {most_common_android_version}")
The most common Android version among top-rated apps is: 4.1 and up
Q15. Please display the top 10 most common Android versions among top-rated apps?
# Get the top 10 most common Android versions among top-rated apps
top_10_android_versions = top_rated_apps['Minimum Android'].value_counts().head(10)

# Plotting with seaborn
plt.figure(figsize=(12, 6))  # Adjust the figure size as needed
sns.barplot(x=top_10_android_versions.index, y=top_10_android_versions.values, color='blue')
plt.title('Top 10 Most Common Android Versions Among Top-rated Apps')
plt.xlabel('Android Version')
plt.ylabel('Number of Apps')
plt.xticks(rotation=45, ha='right')  # Rotate x-axis labels for better readability
plt.grid(axis='y')  # Add gridlines only along the y-axis
plt.tight_layout()
plt.show()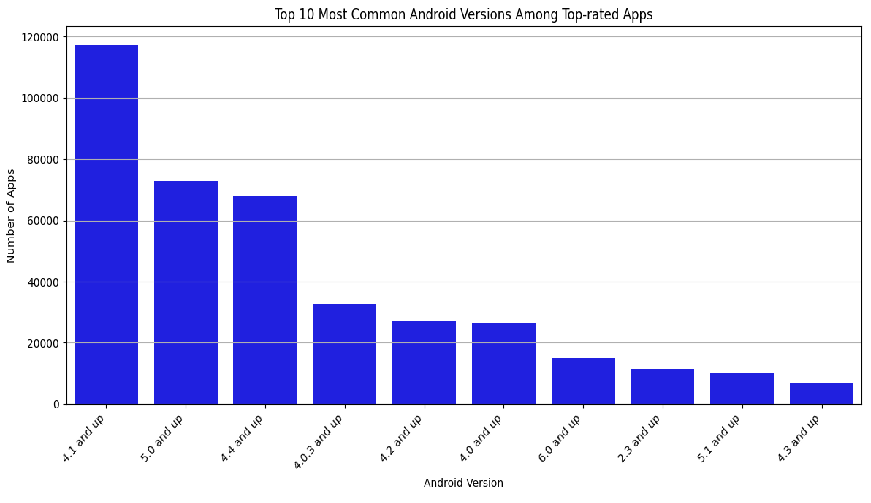
Q16. Please show me the top 10 most installed apps across all categories?
top_10_installed_apps = df.sort_values(by='Installs', ascending=False).head(10)[['App Name', 'Category']]
print(top_10_installed_apps)
App Name Category
605097 Messages Communication
1623195 Android Auto Auto & Vehicles
64838 TikTok Social
785381 Subway Surfers Arcade
1425404 Android System WebView Tools
1870890 YouTube Music Music & Audio
2049898 Google Duo – High Quality Video Calls Communication
752600 Google Play Services for AR Tools
2148656 Google Play services Tools
187863 Samsung Health Health & Fitness
Q17. Please show me the top 5 highest-rated paid apps along with their ratings and prices?
# Assuming df is your DataFrame containing the Google Play Store data
top_5_paid_apps = df[df['Price'] > 0].nlargest(5, 'Rating')[['App Name', 'Rating', 'Price']]

print("Top 5 Paid Apps with Highest Ratings:")
print(top_5_paid_apps)
Top 5 Paid Apps with Highest Ratings:
App Name Rating Price
7718 Iqbaliyat (Urdu) 5.0 0.99
10933 Neo Widgets for KWGT 5.0 1.49
15074 Forest Kitten Live Wallpaper 5.0 1.99
15540 DES 5.0 5.49
24379 Приемка квартиры 5.0 2.49
Q18. Please show me the top 5 highest-rated free apps along with their ratings?
# Assuming df is your DataFrame containing the Google Play Store data
top_5_free_apps = df[df['Price'] == 0].nlargest(5, 'Rating')[['App Name', 'Rating']]

print("Top 5 Free Apps with Highest Ratings:")
print(top_5_free_apps)
Top 5 Free Apps with Highest Ratings:
App Name Rating
3 Smart City Trichy Public Service Vehicles 17UC… 5.0
17 All in one shopping app 5.0
42 Niagara Falls Wallpapers 5.0
43 Extrude Balance 5.0
72 Triple Point Academy 5.0
Q19. Please provide the count of apps in each category
df.groupby('Category').size().sort_values(ascending= False)Category
Education 240530
Music & Audio 154689
Tools 143363
Business 143227
Entertainment 137966
Lifestyle 118145
Books & Reference 116581
Personalization 88981
Health & Fitness 83240
Productivity 79287
Shopping 75132
Food & Drink 73766
Travel & Local 67106
Finance 65211
Arcade 53514
Puzzle 50972
Casual 50596
Communication 47979
Sports 47334
Social 44635
News & Magazines 42707
Photography 35499
Medical 31911
Action 27403
Maps & Navigation 26640
Simulation 23198
Adventure 23116
Educational 21205
Art & Design 18465
Auto & Vehicles 18193
House & Home 14314
Video Players & Editors 13995
Events 12795
Trivia 11760
Beauty 11712
Board 10561
Racing 10330
Role Playing 9958
Word 8614
Strategy 8480
Card 8155
Weather 7220
Dating 6493
Libraries & Demo 5176
Casino 5060
Music 4186
Parenting 3793
Comics 2856
dtype: int64
Q20. Determine the category with the highest prices among paid apps.
# Filter for paid apps
paid_apps_df = df[df['Free'] == False]

# Group by category and calculate the average price for each category
average_prices = paid_apps_df.groupby('Category')['Price'].mean()

# Identify the category with the highest average price
most_expensive_category = average_prices.idxmax()
max_average_price = average_prices.max()

# Print the result
print(f"The most expensive category among paid apps is '{most_expensive_category}' with an average price of ${max_average_price:.2f}")
The most expensive category among paid apps is ‘Dating’ with an average price of $23.86
Q21. Please display the highest-priced apps within each category.
top_priced_apps = df.loc[df.groupby('Category')['Price'].idxmax()]
top_priced_apps[['Category', 'App Name', 'Price']].sort_values(by='Price', ascending=False)| Category | App Name | Price | |
|---|---|---|---|
| 542844 | Productivity | MESH Connect | 400.00 |
| 1534601 | Lifestyle | Why Not | 399.99 |
| 919230 | Entertainment | Luxsure | 399.99 |
| 642302 | Arcade | Challenge Impossible Ball for you | 399.99 |
| 20069 | Tools | TEST EGY | 399.99 |
| 1276472 | Social | RichWall | 399.99 |
| 826958 | Shopping | Premium Luxury Watches – Luxury Watches Brands | 399.99 |
| 1395677 | Board | Most expensive word game | 399.99 |
| 650380 | Books & Reference | secret of life | 399.99 |
| 267948 | Business | Taxes | 399.99 |
| 1440576 | Puzzle | Plasma duct – Premium Game | 399.99 |
| 814716 | Casual | Most Expensive Clicker | 399.99 |
| 1854263 | Music & Audio | AudD | 399.99 |
| 1633789 | Maps & Navigation | Точки интереса | 399.99 |
| 1908008 | Dating | Nu Media TV Live | 399.99 |
| 787211 | Health & Fitness | Acid Reflux Treatment | 399.99 |
| 1600903 | Word | Most Expensive Wordsearch | 384.99 |
| 535840 | Simulation | Presidential Election Campaign | 379.99 |
| 1250613 | Medical | Autism & Pervasive Developmental Disorders 4e | 365.99 |
| 1691339 | Education | PSC Login | 364.99 |
| 1632424 | Art & Design | 10.000 Moving Cities – Same but Different | 354.99 |
| 675663 | Sports | Mega Tips Bet Premium (LifeTime) | 338.99 |
| 1138115 | Educational | Math vs Bath | 294.99 |
| 1227026 | Auto & Vehicles | REPUVE y mas… PRO | 294.99 |
| 765248 | Personalization | INFINITY STONES | 279.99 |
| 987632 | Food & Drink | how to dressed up Low carb Vietnamese pho | 249.99 |
| 2295380 | Finance | VahiKhatu – Track Borrowed / Lent Money | 199.99 |
| 1475691 | Photography | LockMyPix Photo Vault PRO: Hide Photos and Videos | 162.99 |
| 733946 | Weather | Weather – Routing – Navigation | 109.99 |
| 1952542 | Communication | Autocopy | 99.99 |
| 569728 | Video Players & Editors | Training Avid Media Composer 7 | 99.99 |
| 1339959 | Card | The Preflop Advantage | 74.99 |
| 701902 | Action | INFESTED OLD – Horror Game | 59.99 |
| 1239356 | Role Playing | MR Beast ( Fan Game ) | 49.99 |
| 90195 | Travel & Local | PathAway PRO Outdoor Navigator | 44.99 |
| 623250 | Casino | Blackjack Verite Games | 34.99 |
| 750936 | Adventure | 英雄出征2 | 29.99 |
| 1895062 | Trivia | The Jackbox Party Pack 5 | 29.99 |
| 1216057 | Strategy | WARSURGE LIFETIME | 21.99 |
| 221603 | Libraries & Demo | Hide Something – License | 19.99 |
| 1615614 | House & Home | Cannabis Grow App Garden Plants Guide Tool Pro | 17.99 |
| 1203626 | Beauty | Golden Ratio Face – Beauty Analysis & Beauty Tips | 14.99 |
| 697570 | Events | Awe | 11.99 |
| 2183125 | Parenting | Bit Guardian Parental Control – For Parents | 10.99 |
| 24606 | Racing | Virtual Race Car Engineer 2018 | 9.99 |
| 1493937 | News & Magazines | Hn3 news | 9.99 |
| 1763904 | Comics | Perfect Viewer Donation 3 | 9.99 |
| 1799838 | Music | Café Twilight | 9.49 |
Q22. Please show me the top 10 most rated apps in this dataset with the maximum number of user ratings.
top_rated_apps = df.sort_values(by='Rating Count', ascending=False).head(10)[['App Name', 'Rating Count', 'Category']]

print("Top 10 Rated Apps:")
top_rated_apps| App Name | Rating Count | Category | |
|---|---|---|---|
| 384293 | WhatsApp Messenger | 138557570.0 | Communication |
| 303875 | 120206190.0 | Social | |
| 2216065 | 117850066.0 | Social | |
| 878819 | YouTube | 112440547.0 | Video Players & Editors |
| 243569 | Garena Free Fire – Rampage | 89177097.0 | Action |
| 2089577 | Messenger – Text and Video Chat for Free | 78563229.0 | Communication |
| 422719 | Clash of Clans | 56025424.0 | Strategy |
| 57901 | PUBG MOBILE – Traverse | 37479011.0 | Action |
| 64838 | TikTok | 36446381.0 | Social |
| 1825521 | Google Photos | 35369236.0 | Photography |
Q23. Let’s find out the number of users for each rating to understand how many apps received ratings
rating_counts = df['Rating'].value_counts().reset_index()
rating_counts| index | Rating | |
|---|---|---|
| 0 | 0.0 | 1055706 |
| 1 | 5.0 | 99863 |
| 2 | 4.2 | 87820 |
| 3 | 4.4 | 86151 |
| 4 | 4.3 | 83130 |
| 5 | 4.6 | 78177 |
| 6 | 4.5 | 76632 |
| 7 | 4.1 | 69583 |
| 8 | 4.0 | 67219 |
| 9 | 4.7 | 62127 |
| 10 | 4.8 | 61010 |
| 11 | 3.9 | 55575 |
| 12 | 3.8 | 53760 |
| 13 | 4.9 | 44430 |
| 14 | 3.7 | 43208 |
| 15 | 3.6 | 35920 |
| 16 | 2.9 | 34060 |
| 17 | 3.5 | 31560 |
| 18 | 3.4 | 28849 |
| 19 | 3.3 | 22560 |
| 20 | 3.2 | 21426 |
| 21 | 3.0 | 17230 |
| 22 | 3.1 | 15501 |
| 23 | 2.8 | 12199 |
| 24 | 2.6 | 9180 |
| 25 | 2.7 | 9175 |
| 26 | 2.5 | 6922 |
| 27 | 2.4 | 6031 |
| 28 | 2.3 | 5392 |
| 29 | 2.2 | 4932 |
| 30 | 2.0 | 3791 |
| 31 | 2.1 | 3659 |
| 32 | 1.8 | 2941 |
| 33 | 1.9 | 2574 |
| 34 | 1.7 | 1919 |
| 35 | 1.6 | 1635 |
| 36 | 1.5 | 1154 |
| 37 | 1.4 | 1005 |
| 38 | 1.0 | 709 |
| 39 | 1.3 | 571 |
| 40 | 1.2 | 528 |
| 41 | 1.1 | 235 |
Q24. Please display the year-on-year comparison of apps per content rating?
# Assuming df is your DataFrame containing the Google Play Store data

# Extracting the year from the 'Last Updated' column
df['Year'] = pd.to_datetime(df['Last Updated']).dt.year

# Grouping the data by content rating and year, and counting the number of apps in each group
apps_per_content_rating_year = df.groupby(['Content Rating', 'Year']).size().unstack(fill_value=0)

# Displaying the result
print("Year-on-Year Comparison of Apps per Content Rating:")
print(apps_per_content_rating_year)
Year-on-Year Comparison of Apps per Content Rating:
Year 2009 2010 2011 2012 2013 2014 2015 2016 2017 \
Content Rating
Adults only 18+ 0 0 0 0 0 1 2 3 8
Everyone 13 215 854 2238 6616 15799 35231 60510 122987
Everyone 10+ 0 2 9 23 114 319 675 1117 2101
Mature 17+ 0 0 15 19 59 160 406 930 1794
Teen 0 4 19 45 200 614 1944 3742 7958
Unrated 0 1 1 2 19 59 40 5 13
Year 2018 2019 2020 2021
Content Rating
Adults only 18+ 5 21 41 53
Everyone 199650 378002 626442 567374
Everyone 10+ 2676 6457 10001 10267
Mature 17+ 4788 10353 19993 21610
Teen 15387 36175 67625 62229
Unrated 5 9 0 0
Q25. Please show me Top 10 Years with the Highest Number of App Releases.
# Assuming you have a DataFrame named df with the 'Released' column containing the release dates of the apps

# Convert 'Released' column to datetime format
df['Released'] = pd.to_datetime(df['Released'])

# Extract the release year and create a new column 'Year_Release'
df['Year_Release'] = df['Released'].dt.strftime('%Y')

# Group by 'Year_Release' and count the number of apps released in each year
cnt_year_app_Release = df.groupby('Year_Release').size().reset_index(name='Count')

# Sort the result by count in descending order and display the top 10 years
top_10_years = cnt_year_app_Release.head(20).sort_values(by='Count', ascending=False)

print(top_10_years)
Year_Release Count
10 2020 612959
9 2019 479031
8 2018 334028
7 2017 259377
11 2021 179794
6 2016 166811
5 2015 115287
4 2014 71718
3 2013 42405
2 2012 25665
1 2011 14342
0 2010 4632
We can create a bar plot illustrating the Top 10 Years with the Highest Number of App Releases.
plt.figure(figsize=(12, 6))
plt.bar(top_10_years['Year_Release'], top_10_years['Count'], color='blue')
plt.title('Top 10 Years with Highest Number of App Releases')
plt.xlabel('Year')
plt.ylabel('Number of App Releases')
plt.xticks(rotation=45)
plt.grid(axis='y', linestyle='--', alpha=0.7)
plt.tight_layout()
plt.show()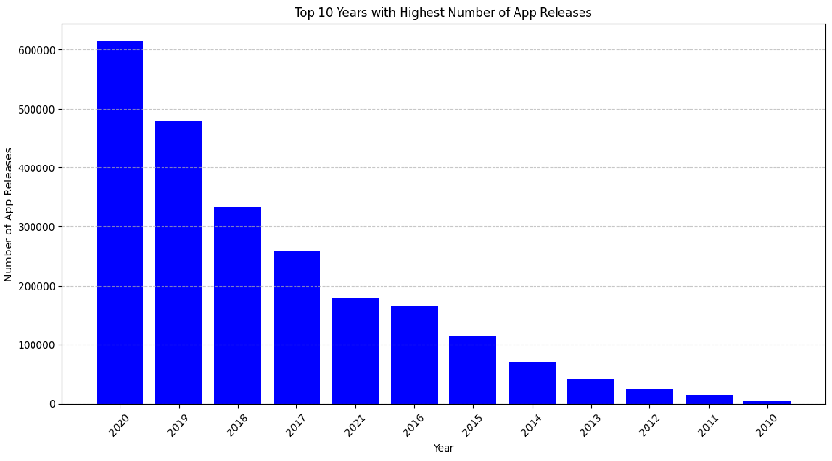
Q26. Please present a scatter plot to illustrate any relationship between user ratings and app prices?
# Plotting the relationship between user ratings and app prices
plt.figure(figsize=(10, 6))
sns.scatterplot(data=df, x='Price', y='Rating', color='blue')
plt.xlabel('Price')
plt.ylabel('Rating')
plt.title('Relationship Between User Ratings and App Prices')
plt.grid(False)
plt.tight_layout()
# Save the plot as an image file
plt.savefig('user_ratings_vs_app_prices.png')
plt.show()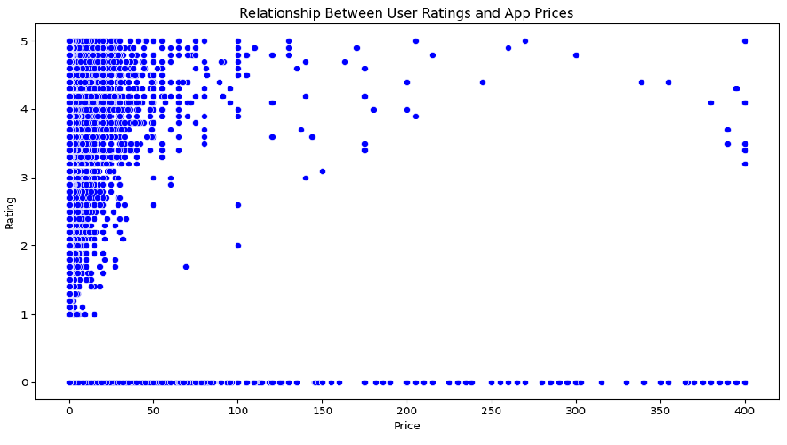
Q27. Please create a scatter plot to visualize if there is any relationship between rating count and app size?
# Plotting the scatter plot
plt.figure(figsize=(12, 6))
sns.scatterplot(x='Size_in_Mb', y='Rating Count', data=df, alpha=0.7, color='blue')
plt.title('Correlation Between App Size and Rating Count', fontsize=16)
plt.xlabel('Size (MB)', fontsize=14)
plt.ylabel('Rating Count', fontsize=14)
plt.xticks(fontsize=12)
plt.yticks(fontsize=12)
plt.grid(True)


# Show the plot
plt.show()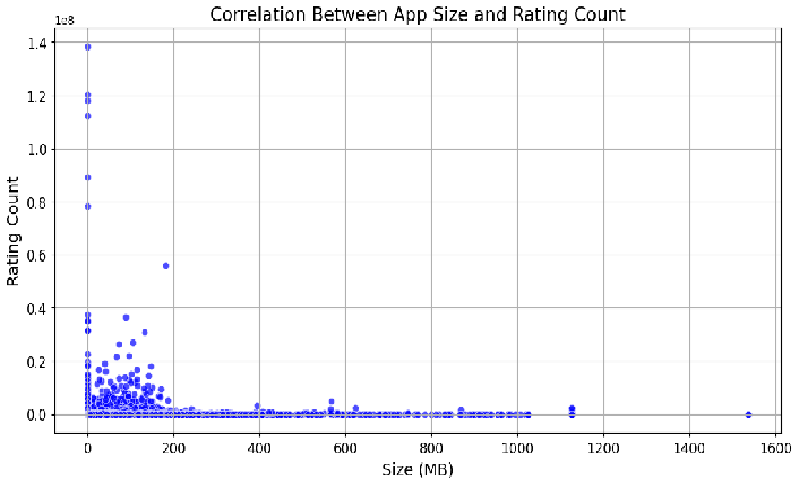
Q28. Show me top 5 Puzzle apps with highest ratings.
# Assuming df is your DataFrame containing the Google Play Store data
top_5_puzzle_apps = df[df['Category']== 'Puzzle'].nlargest(5, 'Rating')[['App Name', 'Rating']]

print("Top 5 Puzzle Apps with Highest Ratings:")
print(top_5_puzzle_apps)
Top 5 Puzzle Apps with Highest Ratings:
App Name Rating
1027 Coptic Memory Game 5.0
1257 Juegos Turismo Villena 5.0
3385 Mars Bubbles 5.0
4385 Neuu Scsim 5.0
4663 2048 Challenge 5.0
Q29. Show me top 5 Medical apps with highest ratings.
# Assuming df is your DataFrame containing the Google Play Store data
top_5_medical_apps = df[df['Category']== 'Medical'].nlargest(5, 'Rating')[['App Name', 'Rating']]

print("Top 5 Medical Apps with Highest Ratings:")
print(top_5_medical_apps)
Top 5 Medical Apps with Highest Ratings:
App Name Rating
1263 CALIPER App 5.0
4904 Argon 5.0
5398 Auxein Medical 5.0
6472 El Menesy Pharmacies 5.0
9030 Ecg.tips 5.0
Q30. Please generate a bar plot showing the year-on-year breakdown of the top 5 categories based on app prices?
Rev_per_Genre = df.groupby(['Year_Release','Category' ])[['Price']].sum()


top5_genres = (Rev_per_Genre
                       .sort_values(['Year_Release', 'Price'], ascending=[True, False])
                       .groupby('Year_Release')
                       .head(5))

# Define a colormap: To present each category with a different color
cmap = plt.get_cmap('tab20')


# Group by year and primary genre, and plot a stacked bar chart
top5_genres.groupby(['Year_Release', 'Category'])['Price'].sum().unstack().plot(kind='bar', stacked=True, title= "Year on Year break down of top-5 Category on App Price", cmap=cmap)

# Customize the plot
plt.xlabel('Year')
plt.ylabel('Total Price')
plt.legend(title='Category', bbox_to_anchor=(1.05, 1), loc='upper left')
plt.show()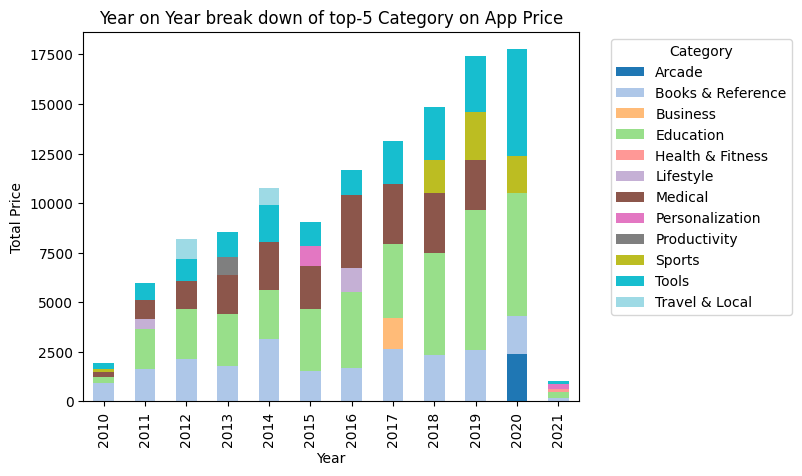
While this wasn’t a thorough analysis of the Google Play Store, we still gathered a lot of information. The depth of our exploration often depends on why we’re doing it in the first place. Our motive guides how deep we dive into the data. If we’re researching a particular category of apps, then we can explore more deeply within that specific category.